|
 |
|
|||
|
|
|||
|
36:
Ergonomics and the Learning Environment
|
36.3 Ergonomic Research Findings and Design Guidelines for the Learning Environment36.3.1 ForewordTwo of the primary purposes of research are to either effect change in an undesirable condition or to verify the efficacy of an existing condition. Consequently, when seeking guidance in developing learning environments, the educational facilities planner looks to the research and to planning handbooks for guidance. This is also true of educators when seeking ways in which a given learning environment may be utilized in order to have the most positive effect on a student's physical well-being and learning. Unfortunately, the topic of effecting learning gains through environmental design or manipulation of its features is beyond the scope and allotted length of this paper. Where I am aware of documentation of specific cause and effect relationships between some physical or sensory aspect of educational facilities and learning, I will report them, but the focus of this part of the chapter will be on those guidelines that are believed to contribute to the health, safety, and physical well-being of the student, as well as those that contribute to his or her orientation toward tasks and localization of information transmissions either from a teacher, other classroom discussants, or from some form of educational technology. For those readers interested in more substantive sources specifically regarding the environment and its effect on human learning, as An initial step toward acquiring such information the author recommends consulting Bruner (1961) and Tessmer and Harris (1992). 36.3.2 IntroductionIn 36.1.4.3, 1 referenced Lane and Richardson (1993) who stated: "The literature dealing with human factors engineering and education is almost nonexistent.... A literature search yielded few resources and little usable information." Taking such statements at face value, we must then look to ergonomic research conducted in other physical settings and other relevant academic and professional disciplines like architecture and engineering in order to find. guidance regarding the design and utilization of the learning environment. This approach is justified when one considers the similarity of tasks that take place in business and high-tech offices, conference rooms, auditoria, etc., and those that take place in educational facilities. In this way, I believe it becomes possible to establish supportable guidelines for educational facilities design. In Analyzing the Instructional Setting, Tessmer and Harris (1992) offer six general questions that those involved in planning educational facilities need to ask of themselves and their project associates:
Should the answers to the first five questions be No, or to the last question, Yes, and should the facility's construction not yet be underway or, at worst, not yet completed, then some rethinking of the facility's design is warranted. If the facility is already constructed, then some form of intervention on the part of its instructors will be needed until the problems are corrected. 36.3.3 ObjectiveIn this section, it is my intention to present guidelines and supporting documentation that should help the reader address these and related questions. And in addressing such questions and reviewing relevant materials, my focus will be on establishing guidelines to promote the efficacy of the learning environment and, as such, improving the comfort, safety, and task performance of the student or trainee. Developing a relationship between task performance and cognitive, affective, and psychomotor learning is beyond the scope of this chapter. Furthermore, the primary audience sought for this chapter are those who have some say in the shaping of educational environments. This audience would include educational administrators, educational facility planners, media specialists, teachers who are members of a building development team, and the architects who serve them all. However, where deemed appropriate, suggestions are offered to help the teacher, trainer, the conference leader, and so forth to utilize better a given learning/training/presentation environment. These are presented in the form of classroom interventions. The number of such entries is intentionally limited and in no way should be viewed as comprehensive. For those interested specifically in finding more information on the environment's effect on learning or how a teacher can manipulate environmental factors for a desired effect, the following sources are recommended: Bugelski (1971); DeCecco (1968); Gagn6 (1965); Levy-Leboyer (1982); Proshansky, Ittleson, and Revlin (1970); Bruner (1961); and Tessmer and Harris (1992). 36.3.4 Getting StartedTraditionally, facility planning handbooks have proven to be a useful starting point toward the creation of an effective learning environment (Castaldi, 1977; DeChiara & Callender, 1980). However, even they need to be verified, modified, or simply supplemented and updated by information from the fields of environmental design and ergonomics in order to maintain their relevance. The relevance of the contributions of ergonomics to facilities design is supported by Hunt and Bernotat (1977), who stated:
The importance of continually updating educational facility planning guidelines has been given additional reinforcement by past and recent ergonomic studies (McVey, 1979, 1990; Bethune, 199 1; Caldwell et al., 1993), three of a number of studies that specifically addressed educational facilities. In the McVey and Bethune studies, students rated specific environmental, display system, and ergonomic features in their classrooms and showed an overwhelming preference for rooms designed in accordance with well-established ergonomic standards. In the Caldwell et al. study, a student productivity loss of 26.2% was recorded and attributed to inappropriate environmental and ergonomic features in a lecture hall. In addition and of equal importance are a number of the findings from ergonomic research conducted in libraries and nonconventional educational settings such as offices, word-processing rooms, and other work settings where computer terminals and visual-display units (collectively referred to as VDTs or VDUs) are employed and where tasks are similar to those found in today's schools, training centers, and conference facilities. What follows is an updated look at those guidelines that have been shown to contribute to the establishment of efficacious learning environments. The focus of this discussion (lighting, acoustics, thermal factors, display systems, etc.) relate generally to all learning environments, including training and conference facilities. However specifics relative to space allocations and furniture dimensions, because of their anthropometric nature, relate specifically to post-ninth-grade students and adults. Those seeking information regarding elementary school and pre-tenth-grade settings are advised to seek it out in other available sources (Packard, 1988; CEFP, 1969; Castaldi, 1977). 36.3.5 The Physical Space36.3.5.1. Room Size and Seating Considerations. The size of the teaching-learning space should be such that it comfortably accommodates the required number of students, space for the instructor's teaching. station and apparatus, and the activities planned for that space. If these intended activities include media use, then additional space should be provided for the setup and use of equipment and for whatever empty floor space is needed to keep viewers from being seated too close to the display surfaces, i.e., chalk and marker boards, projection screens, television monitors, and so forth (McVey, 1985). The importance of appropriate space allocations in classroom design is not only appreciated by teachers but also by their students. In a recent article, The Learning-Friendly Classroom," Caldwell recounts the results of a survey he and Kathy Hoyt conducted involving eight classrooms at the University of California-Davis. In that study, an "uncrowded facility" was cited by 43 faculty members and 890 students as being one of the most important criteria determining the acceptably of a classroom's design (Caldwell, 1994). The use of the word seating in this paper follows the description employed in the work of Tessmer and Harris (1992), who state (p. 3 1):
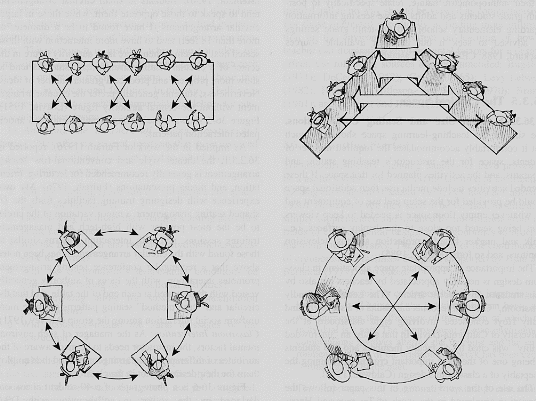
36.3.5.2. Seating Arrangements and Social Interactions. Seating arrangements play an important role in determining social interactions in the classrooms. Students have been shown to experience greater feelings of equality and uniformity when seated around a rectangular table than when seated at a V- or Y-shaped one (Bass & Klubeck, 1952). In a rectangular arrangement, students tend to speak primarily to those opposite and closest to them. However, as soon as a person is seated at the head of the rectangular table, this interaction pattern changes dramatically; now those seated diagonally across from each other tend to engage in conversation about 6 times as often as those directly opposite each other, and about twice as often as those seated side by side (Hall, 1966). Interaction in circular seating arrangements is affected by placement and distance as well as by postures and other physical impressions individuals make on each other (Steinzor, 1950). Students in small. circular arrangements tend to speak to those opposite them, while those in larger circular arrangements (I have found to be a diameter of more than 18 feet) tend to have more interaction with those seated next to them. When there is an authority figure in the center of a circular seating arrangement, students tend to show more progress and produce a greater number of ideas. Nevertheless, students generally prefer the circular arrangement without the central authority figure (Leavitt, 1951). Figure 36-5 shows some seating arrangements and anticipated interaction patterns.
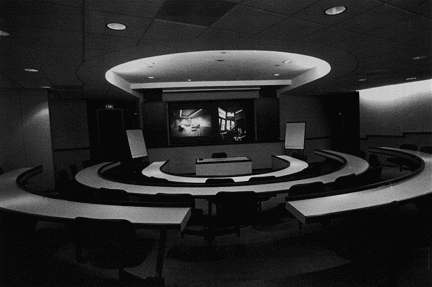
As implied in the work of Fulrath (1976), reported in 36.2.3. 1, the theater style and conventional-row seating arrangement is generally recommended for lecturing, orientation, and media presentations (Fulrath, 1976). My own experience with designing training facilities finds the U-shaped seating arrangement, a minor variation of the circle, to be the most popular with high-tech and management training sessions, and with interaction patterns similar to those found with the circular arrangement. It has been noted above that a rectangular conference seating arrangement promotes interaction, with the locus of authority generally vested with those seated at each end of the table, and that the circular and "case method" seating patterns promote more uniform social interaction among the group (McVey, 197 1). Classroom Intervention: As the manager of such environmental factors, the instructor needs to be made aware of the attributes of different seating arrangements and then employ them for their desired effect in the classroom. Figure 36-6 is a photograph of a 40-student classroom designed by the author in collaboration with DRA Architects of Newton, Massachusetts, which employs a circular seating pattern, with each successive row of seats on risers for improved viewing of the rear-screen display, vertical operable marker board (behind wainscot), and flipchart displays.
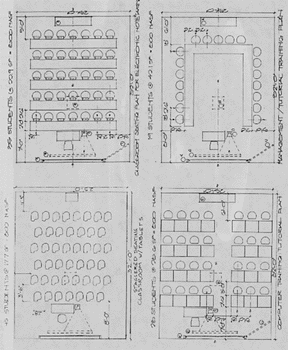
36.3.5.3. Seating Capacity, Configuration, and Room Size. Seating capacity and configuration are major factors in determining room size. As noted by Menell (1976): "Generally speaking, a 20- X 32-foot room will seat about 49 people theater style, 24 people classroom style, 18 people at a U-shaped table, and 15 people at a conference table." My own studies involving a room 25 feet wide by 32 feet long confirm Menell's assertions. Figure 36-7 shows four examples of the same-sized class/conference room with different seating arrangements, table requirements, and the occupancy levels possible.
The following are some guidelines relative to space allocations for different types of teaching spaces that have been substantiated through my own research and found to be useful in facility planning. Additional considerations can be found in the literature (Leed & Leed, 1987; Terlaga, 1990). My own recommendations follow:
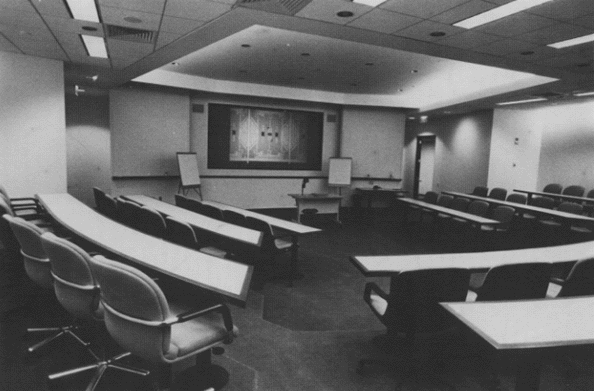
Figure 36-8 shows a room I designed to employ the teacher-student, student-student interaction features case method plan modified for improved viewing of projected media and demonstrations. This design also employs movable ergonomics chairs on casters and as such requires about 10% more space than the conventional case method plan using fixed seating.
36.3.5.3.1 Determining Classroom Size. In light of the variety of potential interactions available to the classroom teacher through employing different seating patterns in the classroom, Tessmer and Harris(1992) recommended that facility planners provide enough space to accommodate the conventional seating pattern that requires the most space, i.e., the U-shaped arrangement. When provided with the space needed to accommodate such space demands, then all of the other less space-demanding seating patterns will be possible. However, the application of the above space allocation recommendations will not be met without some resistance. In the college, government, and business sectors, the primary reason will be budget, since additional space equates to additional cost. But relevant ergonomic data have been successfully employed in overcoming this argument. The greater challenge lies with the public school sector. The reason for this is that many states require strict adherence to their own less-generous program standards, standards that in most cases were developed before the computer arrived on the scene and before teachers were motivated to employ a variety of classroom seating arrangements in their teaching methodology. The inappropriateness of the space standards currently being enforced in most states was recently addressed by Ross and Stewart (1993): Documented space requirement standards for a technology classroom are still in development. The space requirements are larger than traditional classrooms requiring more area than student desks and involving many factors including the type of equipment involved, the instructional methodology anticipated, student age and size, and furniture and storage requirements. Consequently, the school facility planner is currently faced with a dilemma. Ergonomic studies may provide more appropriate space guidelines, but legislation will dictate that current Department of Education (DOE) standards be applied. Operating under this constraint will require some ingenuity on the part of the educational facility planner. One approach would be to see that classrooms employing computers and other space-demanding technologies be programmed as "lecture/laboratory" spaces. This category. traditionally applied to science-teaching rooms usually receives a more generous space allocation in the DOE program standards. And no doubt, there are other approaches that could and should be considered in the worthwhile pursuit for classrooms sized appropriately for the next decade. 36.3.5.4. Ceiling Height. One of the structural features of a room which often reduces the potential effectiveness of projected media is ceiling height (McVey, 1985). A room's ceiling height should accommodate a projection screen large enough to display images of adequate size and positioned high enough from the floor so that sight lines are unobstructed. In the conventional classroom, one can determine the required ceiling height by dividing the room's length by 6 to determine the vertical length of the required screen, and adding to this dimension a minimum of 4 feet (where the bottom of the screen will be positioned) and 6 inches for trim at the top of the screen. Additional ceiling height above the top of the projection screen is required in an auditorium to accommodate an acoustical canopy or "cloud" that can also serve as an enclosure for the room's program playback speakers. However, it is also important that where generous ceiling heights have been provided, this vertical span is not used to raise the projection screen to a height that will cause viewer discomfort. According to Ramsey and Sleeper's Architectural Graphic Standards (Packard, 1988), the vertical viewing angle of the first row occupant to the top of the screen should generally not exceed +30', and never 350. However, this popular handbook provides no empirical evidence to support this guideline. And a major research study (McVey, 1979) clearly showed college students finding a +24' to the top of the projection screen to be more acceptable (p < .0.5) than ones of +32' and +47'. And subsequent field experiments in instructional spaces by the author indicate that sight lines with inclinations greater than +25' (to the top of the display) and depression angles greater than -24' (to the bottom of the display) brought about negative responses from viewers. Sometimes having added ceiling height makes it possible to conduct functions that would otherwise be difficult if not impossible. And example of this is the divisible auditorium I designed in collaboration with the architects at Shepley, Bullfinch, Abbott, and Richardson for the Tufts New England College (see Fig. 36-9). Given the instructors' need to project video to one or both halves of the room while simultaneously video recording a conference setup at the front of the room, a high ceiling was the answer. Employing rear-screen projection above the video-recording stage permitted the beams from the video-recording light to be directed away from the screens, where it would have "washed out" the display, and focused on the people who were being recorded. Note that this screen does not begin at the second-floor level (an undesirable but popular procedure in the past) but is cantilevered forward and downward so that the bottom of it is only 7'3" above the finished floor (AFF). Note also that the screen is tilted forward in order to minimize geometric distortion and maximize uniform image brightness for the greatest number of viewers. It should also be noted that such an arrangement does increase the angle of the front-row vertical sight line to 35', which, though not ideal, is still in keeping with Ramsey and Sleeper's recommendations cited above, and, admittedly, given the special needs of this project, appear to be an acceptable compromise.
36.3.5.5. Room Shape, Seat Location, and Spacing. A room's shape is a major factor contributing to a space's aesthetic character, its overall sense of perceptual appropriateness, and the kind of social interaction pattern that its planners desire to promote. In rooms planned for extensive media use, the configuration of a room and its viewing area can be one of the most significant factors contributing to the effectiveness of the display system, the viewer's comfort, and the strength and clarity of the instructor's voice. 36.3.5.5. 1. Room Dimensions and Viewing Distances. The basic dimensions for lecture halls, auditoria, and large media presentation rooms should be 2:3 (width to length), with seating contained in a fan-shaped area beginning at a distance 2 times the height of the projected image [1.5 times the width (1.5W) for rooms employed for dual-image display systems, and 1W for triple-image display] and extending to a distance of 6 times the projected image height (3W for multi-image rooms) for media employing standard symbol sizes (minimum of 10 arc-min). When displaying computer screens, this maximum viewing distance will vary considerably and be governed primarily by the character size employed in the display. For example, when displaying, say, a PowerPoint screen consisting of large alphanumerics (40 characters per line, C/L), the maximum viewing distance can be 12H. If the display consists of 60 C/L (as produced by 12 pt on a 9-inch Macintosh screen), this maximum distance needs to be reduced to 8H, and for 80 CAL = 6H. For "windows" where a 9-inch screen sometimes consists of 100-120 C/L, the maximum should be 4.5H. These minimum and maximum viewing distances differ from the widely used earlier recommendations (Wadsworth, 1983) in that they attempt to go beyond accommodating film-based media and consider the viewing legibility of computer screens at terminals or via video projection (McVey, 1991). 36.3.5.5.2. Off-Axis Viewing and the Shape of the Viewing Sector As a viewer moves away from the axis perpendicular to a displayed image, an increasing amount of distortion will be experienced because a flat surface is being seen from a more and more oblique angle. The effect of this geometric distortion on symbol legibility can be compensated for by moving off-axis viewers closer to the display, thus increasing the observed symbol size. Classroom Intervention: Set up seating so that the seats off-axis at a point 45' from the display are 80% of the maximum viewing distance, and those located at a point 60' from the display axis are only 60% of the maximum viewing distance. The viewing-seating area itself is fan shaped to improve horizontal sight lines. The boundary for the acceptable viewing area proposed by Ramsey and Sleeper (Packard ' 1988) is an area within two lines extended out 45' from the far sides of the screen or other display surface, i.e., chalkboard, dry marker, etc. However, experimental research (McVey, 1979) has broadened that area to extend to two lines extending out approximately. 30' (actually 27' in the study) from the far sides of the display. Such a wide viewing sector assumes the use of a well-designed display system. See Figure 36-10 for some of these relationships.
36.3.5.5.3. Recommended Room Configurations. The length-to-width ratios for standard-size classrooms are meant to accommodate different seating arrangements and room acoustics. These follow:
With a "case method" seating arrangement: a room 0.8 to 1.2 times longer than it is wide. Note that in classrooms, conference rooms, and auditoria where there is a requirement for simultaneous side-by-side projection and extensive marker board use, the length-to-width ratio approaches 1: 1 and thus requires extra attention for acoustical treatment. Because of their relatively large size, auditoria also require special acoustical considerations. Figure 36-11 is a photograph of a computer classroom I recently designed to feature side-by-side simultaneous projection and marker board display. Note that both halves of the front wall are angled out at each end about 15' so that each display is perpendicular to the center of the viewing area.
36.3.5.5.4. Seat Spacing and Access and Egress. Research has shown that access and egress to seating areas in lecture halls is dramatically improved when seats are spaced a minimum 26 inches on center, and 38 inches front to back. When these chairs are equipped with tablet arms, the preferred spacing is 28 inches on centers and 42 inches frontal. For fixed 18-inch tables with pedestal chairs, the minimum frontal spacing should be 48 inches, including the table (McVey 1979). Movable chairs with five-star pedestal and casters provide stability and ease of access and egress, and because of this are often employed in carrels, conference settings, and "case method" arrangements. This type of seating requires a minimum space of 32 inches, and preferably 36 inches between tables if the occupants are to have unrestricted access and egress, and 42 inches if an instructor expects personally to monitor a student's activities at a particular workstation. Accessibility for all is an important design principle. An accommodation for the special needs of the physically challenged is the law of the land, and also provides access and egress as well as many other benefits to all occupants of a facility. It also contributes to one's sense of acceptance or rejection. As Burch (1993) stated: "Height, size, openness, and accoutrements are all part of the package that is this piece of instructional equipment." The need for accessibility is not limited to seats in the learning environment. Safe, easy, and convenient access to learning resources is also important (Tessmer & Harris, 1992). 36.3.6 The Chair, the Desk, and the Computer Workstation36.3.6.1. Seating Design. Proper seating is an important factor in determining a student's relative comfort and effectiveness as a perceiver, recorder, and processor of information. Furthermore, there is a long history of evidence that improper seating may result in improper skeletal development in children between the ages of 11 and 16 (CCSE, 1938). Since chairs need to accommodate the body dimensions of those who use them, most schools need a variety of chair sizes to serve their student population. In fixed workstations, such as audiovisual/television carrels, video-display terminal stations, and operational control rooms, where a chair has to accommodate a varied user population, pneumatically adjustable chairs are recommended. 36.3.6 1. 1. The Seat Pan. A chair's seat pan should have a modest concave contour so that an individual's weight is distributed evenly in the ischia area of the buttocks. The seat pan should have a "waterfall" shape at its front and should be lightly padded (about I inch) and covered with a porous textured "breathable" nonvinyl. fabric. Overpadding the seat pan should be avoided, since the research indicates that leg discomfort increases with low, soft seat pans, suggesting that postural constraint is more important than thigh compression as a risk factor for leg discomfort (Sauter & Schlifer, 1991). 363.61.2. Materials and Components. The seat and frame parts that come in contact with its occupant should be made of wood or some other thermally nonconductive material. It should be equipped with a padded backrest that provides support both in the lower back (lumbar) and midback regions. Chairs that swivel are recommended for large-group lecture halls and other settings where tasks involve rotation of the torso (Tichauer, 1978). Adding a pneumatic seat height adjustment is desirable for conference rooms, and this along with numerous other adjusting mechanisms are required for chairs used in VDT workstations. 36.3.61.3. Range of Adjustments. Since people, desks, and chairs all vary in height, units with adjustable height and tilt allow the greatest flexibility in avoiding problems (Davis, 1988). According to the Canadian National Standard (Carnovale et al., 1989), a workstation chair should have a minimum adjustable range between 15 inches to 20.5 inches, and ideally a desk's height should be adjustable between 24.8 inches to 30.0 inches. But if it has to be nonadjustable, then it should have a height between 27.9 inches to 28.3 inches. The use of a footrest is recommended, and a chair's backrest should be adjustable 104' to 120', and the seat pan inclined backward 40 to 60 (Grandjean, 1988). Being able to change a chair's height, angle, and pitch will promote, postural shifting, which is an important determinant for both physical comfort and work effectiveness. Such postural shifts are recommended for educational settings by Knirk (1992), "particularly for high cognitively loaded tasks such as those for computer-based training." Classroom Intervention: Unfortunately, all too often the classroom teacher "inherits" chairs and desks that have little if any ergonomic merit. In such situations, Tessmer and Harris (1992) recommend adopting the following classroom management procedures in order to reduce the effects on learning of seating discomfort and inappropriate arrangement:
While the above procedures were intended for elementary and secondary classrooms, they are also appropriate for college and adult learning situations, with the exception of perhaps an adjustment of a seating interval being extended to 45 minutes. 36.3.6.2. The Desk, Computer Workstation, and Working Postures. The design of the notetaking, reading, and working surfaces also contributes to an individual's operational comfort and effectiveness. Horizontal writing and reading surfaces force students to bend forward excessively, setting up stresses in their skeletal and visual systems which can cause digestive, respiratory, visual, and postural problems (Harmon, 1951). And as early as 1938, one can find orthopedic reports showing that improper seating support can result in kyphosis (curved or bent back) and scoliosis (twisted spine) in children between the ages of 11 and 16 (CCSE, 1938). Another but more benign problem created by flat desks is noted by Tessmer (1994), who believes that excessive bending forward can affect a student's attention to learning tasks. 36.3.6.2.1. Inclined Reading/Writing Surfaces. Proper reading and writing posture is promoted by a desk or writing surface that is tilted somewhere between 10 to 20' from the horizontal (Freudenthal et al., 1991; Diffrient et al., 1974; deWall et al., 1991). In a major study at a large university, a writing/reading surface tilted 15' from the horizontal received significantly higher ratings from college students than did writing surfaces that were inclined 0', 2', and 7- (McVey, 1979). Figure 36-12 is a photograph of the desk designed by the author and constructed by the Haywood Wakefield Company for the University of Wisconsin's two lecture halls in the then-new (1972) School of Education facility. Note the 15' inclination of the surface and also its light color and matte texture. Also note the flatness of the paper/book restraining device. This was done to minimize pressure on the student's forearms and wrists when writing. Having inclined writing surfaces is not only recommended for college age students but also has been shown to be particularly favorable for children (Bendix & Hagberg, 1984). Inclining the desk top 30' to 45' places reading and viewing materials at even more comfortable inclinations but will not allow items to remain unattended without falling off. This is why less-acute inclinations have thus far been favored. And it stands to reason that horizontal work surfaces have been found best for three-dimensional manipulative tasks. About 40 years ago, the physiologist Darrell Boyd Harmon, in an effort to meet this challenge, designed for the American Seating Company a solid wood-metal seat-desk combination that was adjustable for students of different sizes and had swivel seats and an adjustable top that could accommodate the various work surface angles that were recommended for the full range of activities found in the standard classroom of the day (Harmon, 195 1). Classroom Intervention: Since most worktables and desks available to the student will probably be horizontal, the teacher should demonstrate for the students and encourage them to prop up their reading material with a thick book (3 inches), or by writing on a clipboard propped up by a 2-inch book. By placing these two tasks at these angles, the teacher will be promoting better posture, visual comfort, and speed and accuracy in reading and writing. 36.3.62.2. Accommodating the Computer (VDT). Today, the term VDT (visual-display terminal) is used primarily to mean computer monitor and keyboard, but its application is also extended to cover any display device employed at a workstation and its research findings applicable to all variations on this theme, i.e., video-display terminals, CRTs (cathode ray tubes), VDUs (visual-display unit, i.e., microfiche readers), etc. Working at VDT workstations can be fatiguing and create physiological stress if seating-display relationships are not ergonomically correct. Working with VDTs, Sauter and Schlifer (1991) have found the erect seating posture to be associated with less-frequent discomfort than either stooped or reclining postures. Ibis association is consistent with the classic view regarding healthy seating postures (Akerblom, 1954), but contrasts with at least one study that showed preference for reclining posture in VDT work (Grandjean et al., 1983). 36.3.6.2.3. Recommended Postures. Horowitz (1992) indicates that the right kind of furniture can help VDT users avoid crippling injuries by promoting what we have come to know as good posture. She recommends that furniture should be installed which promotes student posture with the following characteristics. It should be noted that these recommendations also apply to conventional reading and writing activities.
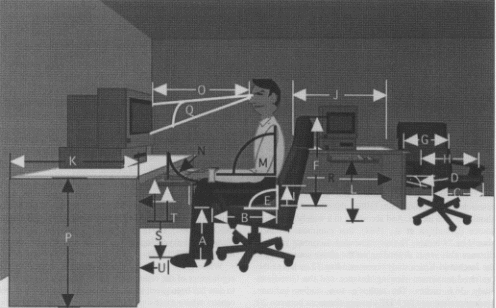
One of the obvious objectives of Horowitz's recommendations is to establish a posture where the neck, back, upper arms, hips, and ankles are aligned at an angle approximately 90' to the floor, and with the forearms parallel to it. This is consistent with established ergonomic guidelines for VDT workstations (HFS, 1988). Ibis arrangement will avoid positioning the head forward over the spine, with the shoulders and upper back following to produce an undesirable slump. Given that the head represents a considerable weight (about 10% of the total body), maintaining such an unbalanced load sets up stresses in the musculoskeletal. system. Sustaining such a posture while operating a keyboard for an extended period of time will result in excessive compression of the nerves and blood vessels in the neck, over the upper ribs, and down the arm. This cumulative trauma is referred to as a thoracic outlet syndrome. In addition to upsetting nerve control and circulation to the arms, the syndrome can also contribute to other CTD problems further down the arm (Hebert, 1989) 36.3.6.3. VDT Keyboard Height and Configuration. The coordination of seating, viewing, and work positions is important to those whose learning activities involve computer terminals, using microfiche readers, video monitors in carrels, or VDT workstations. Research indicates that "many existing desks are not deep enough to accommodate a VDT and leave room for a generous wrist/forearm support for the use of a keyboard" (Porter et al., 1992). Whatever the support mechanism, it is important that the VDT keyboard height be on a plane with, or slightly below, elbow level. Sauter and Schlifer (1991) found that arm discomfort increased with increases in keyboard height above elbow level, and their findings are in agreement with Bendix and Jensen's (1986) electromyographic data that showed reduced trapezius loads with lower keyboard placement. The angle of the keyboard should be such that the user can assume a position where the hands can be held in a neutral position, without excessive "extension" (palm down and wrist bent upward), "flexion" (palm down and wrist bent downward), "ulnar deviation" (rotating or tipping the hand toward the little finger). Experiments with a "split" keyboard design and with solid keyboards where the two keyboard halves have an opening angle of 25' and shaped with a lateral support of 10' were found to lessen the extent of inward rotation of the forearms and wrists and reduce physiological strain (Zipp, 1983). Other recommendations relative to keyboard design include detachability (HFS, 1988) or movability on a desk, with a support for forearms and wrists, the keyboard having a minimum depth of approximately 6 inches (Grandjean, 1988). Figure 36-13, taken from one of my student's current studies (Badolato, 1995), summarizes the principle characteristics and dimensions recommended by different respected sources regarding computer workstation design. In his study, Badolato has applied these to the analysis of his own experimental settings, a series of music training classrooms at the Berklee School of Music in Boston. Readers should find this summary useful in their own future design and furniture selection activities.
36.3.6.4. The VDT and Viewing Distances. Because of the time-intensive nature of most VDT work, this subject has received considerable attention by leading ergonomists. Their work concerning viewing distance and viewing angle is summarized in the form of recommendations, as follows: 36.3.6.4.1. Viewing Distance from the VDTScreen. The absolute minimum distance according to a British standard (BS7179, 1990) is 15.7 inches. But according to the research of Jaschinski-Kruza (1988), the minimum distance should be 19.6 inches. And according to a widely respected source (Grandjean et al., 1984), that minimum distance should be 24 inches. The recommended maximum viewing distance also varies depending on the above sources, with the Jaschinski-Kruza study recommending 32 inches as the preferred maximum viewing distance and the Grandjean study, 36.6 inches. The author's own studies indicate student preferences for VDT viewing distances between 20 to 28 inches. 363.64.2. Viewing Angle to the VDT Screen. Some sources recommend that the top of the VDT screen be on a plane with a person's eyes (Eggleton, 1983). Other sources recommend a more acute downward angle (Ankrurn & Nemeth, 1995). Hill and Kroemer (1988) recommend that the line of vision center on a downward angle between -29' to -38', with the viewing distance decreasing at greater downward viewing angles. Support for this change in recommended viewing distance with increased declination angles is offered by Ripple (1952), who describes the "nee' visual field as being "a curved surface concave toward the eye and curving deeper in and down and flatter up and out." The author's own experiments have shown a preference for a viewer-monitor arrangement where the top of the display does not extend above the viewer's -5' horizontal line of sight, and the bottom not below the viewer's -40' horizontal line of sight. Where lighting conditions permit, the display screen should be inclined backward somewhere between 20' to 45' from the perpendicular. It should be noted that while inclining the monitor in this manner minimizes perceived geometric distortion and makes use of the increased visual accommodation experienced at downward viewing angles, it will require special care in the room's lighting design in order to control for excessive reflected glare. Figure 36-14 shows a computer training classroom I designed employing student workstations where the computer monitor is located inside the desk and below its glass work surface. This concept has been shown to have merits as we,U as some Urnitatiam, particularly in educational programs in which students often work in pairs. Complaints with it relative to glare of its glass surface, as well as off the monitor, were generally eliminated with the use of the glare hood provided by the manufacturer and by fitting each monitor with an antiglare polarizing screen. 36.3.6.5. Repetitive Motion Problems. With the increased use of VDTs primarily in offices has come increased incidents referred to as repetitive motion disorders (RMD) or cumulative trauma disorders (CTD) affecting different parts of the body (arms, shoulders, neck, legs) and a variety of sensory functions. A 5-year prevalence rate for RMI)s of nearly 35% has been reported in some Australian organizations (Hocking, 1987), and Japan experienced a similar phenomenon during the 1970s (Nakaseko et al., 1982). In the U.S., the most prevalent RMI)s are carpal tunnel disorder (CTD) problems, which are primarily caused by the excessive compression of the median nerve in the wrist and which account to up to 3% of all VDT users. According to the National Institute of Occupational Safety and Health (NIOSH, 1991), CDTs are primarily caused by inadequate physical and psychological workplace design or ergonomic factors (NSWI, 1992). While great strides have been made in improving the ergonomics of the office work environment, little attention to date has been given to classrooms, libraries, and resource centers where extensive VDT use is a regular occurrence. It is anticipated that significant levels of RMI)s including CDTs will soon be noted in the education sector. Today's educational facility planners should look to office design research results for guidance in preventing the onset of such problems. 36.3.7 The Acoustical Environment 36.3.7.1. Room Shape and Acoustical Treatment. There are a number of sources that can help the facility planner and designer create the proper acoustics for a space (Yerges, 1969; Doelle, 1972). The following generalizations apply: A room's shape affects its acoustics. The orientation of a room's walls, ceiling, and floor should be such that sound is reflected from the front of the room toward the back. To accomplish this, side walls should be nonparallel (splayed). In large-group media rooms and auditoria, floors should be stepped or inclined. The ceiling section over the instructor should also be inclined toward the audience so that the speaker's voice is projected forward, although part of this sound should also be reflected at a slight downward angle so that instructors will have no difficulty hearing their own voice. A room's shape should propagate sound throughout, but in a diffused fashion. Consequently, concave curved walls are usually not recommended, since they tend to refocus reflected sound waves. The character of each room surface should be consistent with the general acoustical treatment of the space. The ceiling above the lecture stage should be sonically reflective. If reflecting panels (acoustical clouds) are used, they should be no smaller than 8 feet wide, or else they will not should be no smaller than 8 feet wide, or else they will not reflect the lower sound frequencies. While it is generally recommended that the front half of the space be acoustically reflective, it is also recommended that the rear half of the room be acoustically absorptive so that sound waves will not be reflected back toward the front of the room. This condition can usually be accomplished by putting acoustical tiles on the rear one-third of the ceiling and acoustical carpet or other sound-absorptive material on the rear and side rear walls. Installing carpeting on the floor area usually completes the acoustical treatment of a room while adding a welcomed bit of texture and color to the space. In a large auditorium that is used for a variety of activities involving groups of varying numbers, the addition of upholstered chairs may be required to keep the room's reverberation time near a desired constant. The reader should note, however, that getting an educational institution to provide upholstered chairs for its lecture halls is not an easy task. Back in 1970 when I had selected the seating for the University of Wisconsin's ergonomically designed auditorium/lecture hall, I was successful in getting the university to agree to adding padding and fabric to the seat pan and backrests of the Haywood Wakefield swivel chairs selected and installed at the site. And, interestingly, the only justification they would accept for such an expenditure was for improved acoustics. Student comfort was not enough. However, before the modifications could be made, the university's swimming pool sprung a leak, and the money allocated for the chair modification was diverted to that emergency. And since I left that institution at the start of the next fiscal year, there was no one to "champion" spending the additional money to make the desired modifications, and so that particular ergonomic improvement was never made. 363.7.2. Noise and Performance. Noise, i.e., unwanted sound, is generally not desired in learning environments. However, broadband "white" or "pink" noise, sounding somewhat like an open TV channel or an air-conditioning unit, is used at moderate amplitudes as a noise-masking agent to create speech privacy in open offices and open classrooms. Some of the general affects unwanted sound has on people include annoyance, distraction, or interference with communications, leading to altered performance of some tasks (Eggleton, 1983). The effects of noise have been investigated by a number of people (Broadbent, 1957; Cohen, 1969; Kryter, 1970; Miller, 1971; Taylor, 1988; Kjellberg & Skoldstrom, 199 1). 36.3.7.2.1. Noise Measurement. Ambient noise is usually measured either in decibels on the "A" scale (the scale most closely approximating the human hearing curve) or by plotting decibel levels at each of the nine major center octave bands. The set of curves that results from this activity are either called noise criterion or NC curves or preferred noise criterion or PNC curves. The PNC curves were developed by the originators of the NC curves, about 14 years later, as an improved version of ambient spectra that could be recommended for specific activities. The two sets of curves are nearly identical, except with the PNC being less permissive in the very low and very high frequencies by 4 to 5 dB. Basically, one determines a room's NC or PNC curve by plotting the sound pressure levels of the principle octave band frequencies on either set of curves, i.e., contours, and notes the highest rank contour tangent to or touched by any one of these readings. That upper-curve designation is used to identify the room's NC or PNC number. And, since the research cites both versions, as well as the benefits of decibel levels on the A scale as predictors for acceptability, all three versions will be used as they were originally cited in the literature. . 363.7.2.2. Noise Limits. While total quiet is never recommended, it is important that the learning environment provide spaces of relative quiet to serve as retreats from the din of school and nonschool activities. Noise levels exceeding 70 dBA will not only interfere with communication and mental performance but also produce a disorienting, chaotic learning environment. Noise levels of 85 dBA and above are generally considered psychologically and physiologically excessive. It is well known that prolonged exposure to excessive noise levels causes both temporary and permanent hearing loss. Such loss is usually thought of as an adult problem, but this is a misconception. Even our youngest citizens are not immune. One study of 3,000 students at three grade levels revealed that 5% of the sixth-graders, 14% of the ninth-graders, and 20% of the twelfth-graders showed some measurable hearing loss induced by the general noise level of their environment (Lexan, 1969). Temporary hearing loss may become permanent unless the victim is given a sufficient hearing recovery period away from the noise. Other disabilities that can be caused by excessive noise include cardiovascular disorders, nausea, weight loss, fatigue, irritability, insomnia, and impaired tactile functioning (CEQ, 1968). Again, relief can be found only by eliminating the noise or by moving away from it to a quieter envirdninent. Classroom Intervention: Efforts to reduce noise are based on isolation, absorption, and containment. Isolation means eliminating the medium a sound needs in order to travel. For example, placing a rubber or neoprene pad under a noisy projector or printer can do much to keep its noise from being transmitted via the table and floors. Likewise, placing audiospeakers away from the front wall of a classroom will keep their sound from being transmitted as vibration through the structure and disturbing the adjacent room. 36.3.7.2.3. The Character of Noise and Its Consequences. Excessive decibel levels are not the only problem. Someone else's music or conversation can be perceived as noise by others. Grandjean (1987) has shown that conversation is one of the most disturbing types of noise that can intrude on mental concentration, specifically because of the informational content it contains. It has also been shown that excessive conversational noise, in the range of 60 decibels on the "A" weighted scale (60 dBA), can negatively affect reading comprehension, particularly of students most susceptible to such distractions (Veitch, 1990). And while noise adversely affected performance on a proofreading task, this affect was only significant when this task was machine paced as opposed to when it was self-paced (Kjellberg & Skoldstrom, 1991). Weinstein (1979) found that noise levels between 68 to 70 decibels decreased student performance even on short-term tasks. Glass (1985) found that loud, distracting noises interfered with the performance of complex mental tasks and led to fatigue. Noise features that are likely to degrade performance include: Variability in level or content High-level repeated noises Intermittency Frequencies above approximately 2,000 Hz Any combination of the above
Ross and Stewart (1993) cite the work of Bobker (1991) in making their case that technological equipment by itself tends to make annoying and disconcerting sounds. They report that some computer users have complained of ringing in their ears (tintinnabulation), and that many multimedia programs, employed in schools, have built-in sound effects for student motivation. They state: "The continual din of these can be disconcerting to classroom instruction." It is important that designers of computers be encouraged in their continued efforts at quieting their machines, and it is critical that the problems associated with the audio components of multimedia workstations be thoroughly researched so that these new technologies be made to coexist with other important learning activities, otherwise their continual adoption by educators may be resisted because of their "noise" intrusiveness. 36.3.7.2.4. The Too-Quiet Room. It is also known that an environment that is too quiet can also lead to distractions and annoyance. Given the tasks that a student is likely to perform when using a VDT, one can predict greater awareness to noise distractions if the ambient noise level is lower than 35 dBA or NC30. Generally, one can usually expect the lighting and the heating, ventilation, and air-conditioning (RVAC) systems, and the fans in the computer itself, to generate at least this level of ambient sound. However, when an environment is too quiet for its programmed activities, the addition of artificially generated broad spectrum sound is recommended. It is in this regard that Hannon (1966) noted that the addition of 30 dBA of "white" noise, a soft "whooshing" sound, produced the optimum body tonus necessary for alignment of attention to a performance task. Classroom Intervention: When students need to concentrate on a demanding task, a small amount of "white noise" (meaningless sound made up of tones of all audible frequencies) may be used as a sound-masking device to keep them from being disturbed by extraneous classroom sounds like talking or traffic. Personal "white noise" generators are currently available for around $100, but the class-
room teacher can produce an acceptable substitute by simply making a tape recording of the sound generated by a TV set when it is turned to an unoccupied channel. The teacher can then play this recording, at a low level, which will sound very much like white noise in the classroom whenever he or she wishes to mask extraneous and distracting noises. The currently available environmental recordings of the sea, wind, etc., can also be used as noise-masking devices. While people have different reactions to noise-masking systems, most seem to accept broadband steady-state sounds as a constant element in their environment as long as the levels do not exceed 47 dBA or NC43 (Yerges, 1978; ASTM, 1976). Given that spaces with many VDTs require more cooling than the standard classroom environment, extra care needs to be taken with HVAC design to ensure that the general background noise level correlates with the levels recommended for its programmed activities and in no instance exceeds 47 dBA. 363.7.2.5. The Role of Background Music. Music, in general, tends to speed up the fundamental physiological processes and to raise the level of body tonus (the muscular and nerve readiness to perform). Because it also tends to increase muscle endurance, music can reduce or delay the fatigue associated with a physical worktask. In recent years there have been many attempts to use music as background sound for various school tasks. The success or failure of such attempts has depended on the nature of the music and the nature of the task. While nonfamiliar music, especially if it has few major frequency and volume shifts, can help many students concentrate on their work, familiar music can be an informational distraction. The rhythm of the music is most important. If it does not match the rhythm of the worktask (typing, handwriting, or whatever), it can cause a decrement in the student's performance. 36.3.7.3. Noise and Communication. Figure 36-15 shows the preferred noise criteria (PNC) curves and the excessive ambient noise conditions I recorded in six elementary classrooms. These readings show the extent of the problems that can be created by window ventilators and room air-handling systems. Most of the experts are in agreement with Kryter (1970) that in classrooms where unamplified speech is used in teaching, the background-noise level should be not less than NC 25 (30 dBA) and no more than NC 35 (35 dBA). These same classroom background-noise levels are also recommended for classrooms serving students with hearing disabilities (Ross, 1972; John, 1960). The recommended ambient noise level for auditoria is NC 25, and for recording facilities, NC 15-20 (Doelle, 1972). See Table 36-4 for the preferred noise criteria ranges recommended for various indoor-activity. areas deemed relevant to the reader. Increasingly, a variety of media are being employed in educational and training environments at all grade levels from elementary schools through postdoctoral and corporate educational programs. Today it is not uncommon to find anywhere from 10 to 30 VDT workstations in a classroom setting where background-noise levels have to be low in order for accurate verbal communications, an essential element in the teaching-learning process. Here again, the NC 35 level has been shown to provide an acceptable noise level for such activities.
Figure 36-15. Preferred noise criteria (PNQ curves with noise spectra plotted for six elementary classrooms.
36.3.7.3. L Signal-to-Noise Ratios. The contribution to communications efficacy made by relatively low ambient noise levels is seen in the signal-to-noise (S/N) ratios found in classrooms. The relationship of the sound pressure level (SPQ of a person's voice to a room's background or ambient sonic-energy levels is termed the signal-to-noise ratio (S/N). Woodson and Conover (1973) note that at S/N ratios of +15, +10, +5, and 0, one can expect word intelligibilities of 82%, 78%, 70%, and 58%, respectively. And Van Cott and Kinkade (1972) indicate that 75% word intelligibility is required for reliable conversation to take place.
Furthermore, this same source notes that reliable conversation will barely exist for people as close as 12 feet using normal voice levels (reported by Van Cott & Kinkade to be 49 dB at 12 feet) when the room noise level is 43 dB (S/N +6). They also report that when this background noise level is raised to 49 dB, accurate conversation is barely possible even at 12 feet when using a raised-voice level of 53 dBA (S/N +4). It should be noted that ambient noise levels of 49 dB and even 43 dB, while considered excessive, are not uncommon in today's classrooms where window air circulators or overhead air diffusers are improperly set up or balanced, or where the noise from computer peripherals such as printers is not attenuated through either acoustic absorption or isolation. Figure 36-16 offers a good visual representation of how reductions in S/N ratios, caused by window ventilators, affected speech intelligibility by masking consonant sounds as heard in six different elementary classrooms tested by the author.
Classroom Intervention: The classroom teacher can promote a desirable signal-to-noise ratio by preventing extraneous sounds from entering the classroom through open doors or windows. The S/N ratio for a student sitting by a door leading into a noisy corridor often approaches zero. Whenever climatically feasible, classroom doors and windows should remain closed during those hours that require mental and verbal activity. Students as well as teachers have a right to quiet, and they should express that right whenever noise intrusion hinders their learning activities. The sense of freedom in the classroom should be such that a student who is being disturbed by outside sounds will not hesitate to leave his or her seat and close a door or window. A common occurrence is where instructors leave a slide or overhead projector on long after they have finished showing their visual materials. This unwanted noise reduces the intelligibility of the instructor's voice at a time when continued use of these devices serves no useful purpose. It is one thing to suffer unwanted background noise while the media are in use, but it is simply inconsiderate and poor classroom management to continue to generate such noise and negatively affect S/N ratios after such equipment operations are no longer required. 36.3.7.4. Reverberation Time. A room's reverberation time (RT) refers to its liveness and deadness and is expressed as the number of seconds that it takes for a sound level to decay 60 decibels. Traditionally, recommendations for RTs have been associated with the size and function of a given space, and according to Kryter (1978), "Normally, smaller rooms should have shorter times than larger rooms; and music spaces usually require longer times than spaces used principally for speech." Today's study areas, resource centers, and open-plan classrooms and offices, however, while large in overall size, consist of numerous small and independent workstations where speech privacy and accurate personal and, in many cases, telephone communications are to take place. Consequently, it is recommended that such spaces have RTs at the lower end of the scale, i.e., 0.6 to 0.8 seconds. Classroom RTs between 0.7 and 0.9 seconds are considered optimum for normal-hearing individuals (Ross, 1972), with a RT of 1.0 second as a limit for the conventional-size classroom (Niemoeller, 1968). 363.7.4.1. Reverberation 771me and the Hearing Impaired. Given that mainstrearning hearing-impaired students into general educational programs is the norm, we should look at their special needs regarding reverberation time. Studies from the field of clinical audiology and sensory disabilities have shown that such individuals experience noticeable difficulty when RTs exceed 0.7 seconds (Niemoeller, 1968; John, 1960), leading John (1960) to recommend that RTs for rooms in which hearing-impaired students are to be placed not exceed 0.5 seconds. The only practical way such low RTs can be achieved in today's classrooms is through adding significant amounts of soundabsorbing materials to a room's surfaces. The positive effect of such acoustical treatment on speech discrimination i n* general classrooms has recently been supported by the research of Pekkarinen and Viluanen (1990). Classroom Intervention: The different reverberation times in different rooms should always be considered by teachers making tape recordings, for these will affect the intelligibility of the tapes when they are played back. When an audiotape made in a recording studio or a classroom having a short reverberation time is played back in an auditorium or classroom having a long reverberation time, words seem to run into each other, pauses are lost, and speech becomes unintelligible. A teacher can compensate for this problem somewhat by making a concerted effort to slow down his or her speech when recording in a studio or any other room with a short reverberation time. 36.3.7.5. Acoustical Design and Corrective Work. Guidance for acoustical procedures, including isolation, containment, and surface treatments, can be found in numerous sources (Doelle, 1972; Harris, 1957; Close,
1966; Yerges, 1978; Propst, 1968; Packard, 1981). The need for innovative acoustical design is expected to increase in importance with the development of new educational technologies. Parsons (1986) claims that the demands of new electronic technology are not getting the attention of individuals who traditionally are responsible for designing learning environments. According to Allen and Charles (1986), "as more voice-operated machines are introduced, effective sound separation will become even more crucial, so that machines will be able to identify and respond to their masters." Thus, the acoustical needs of the tomorrow's learning environments will increase rather than lessen.
36.3.7.6. Sound Systems 363.7.61. Sound System Quality and Directionality. 'Sound enhances visual perception by giving it contrast and adding information. Sounds can be used to direct attention to related visual elements (Broadbent, 1958). People tend to position their bodies in a direct line with the apparent source of a sound. Therefore, in setting up audiovisual aids, teachers should coordinate the placement of a projector's loudspeaker with the projected image and, of course, the classroom seating. The better-designed movie theaters provide the ideal arrangement: The loudspeaker used to play back dialog and critical localizing sounds is located directly behind the projection screen at a height approximately two-thirds the vertical span of the screen. Such theaters use a fixed perforated projection screen that allows sound to pass undisturbed right through it, thus creating the illusion that the sound is coming from the elements appearing on the screen.
Classroom Intervention: For most classroom audiovisual presentations with portable equipment, placing the loudspeaker on a bench or chair directly in front of and below the extended projection screen will be acceptable. 363.7.62. Sound System Selection. It is a well-known fact that audio amplification and distribution systems can contribute to the effectiveness of audiovisual materials. A good playback sound system should reproduce both monophonic and stereo signals and have sufficient power, good sensitivity, low distortion, and smooth frequency response. Ideally, as noted above, reinforced sound should appear to emanate from the informational display area (e.g., the projection screen). In an auditorium, this effect can be achieved by mounting a central monophonic speaker cluster or stereo speakers in the acoustical cloud above the projection.screen or in smaller rooms at each side of the projection screen about 7 1/2 feet from the floor, preferably recessed into the wall. While it is possible to use the program playback speakers for voice amplification, usually in lecture halls and auditoria, it is recommended that a separate distributed speaker system be installed in the ceiling. Standard-size classrooms and conference rooms generally require only program playback speakers, not voice amplification systems. A ceiling-distributed speaker system is a practical solution that works well for rooms with low ceilings or poor acoustics. This is because people have difficulty sensing the displacement of a sound's source when it is in the vertical plane, unless it is displaced from the vertical by more than 45' (Wysotsky, 197 1). Consequently, in a properly spaced ceiling-speaker system, the illusion that the sound is coming from the lecturer or the display is maintained even though the speakers are located overhead. In such a system, speakers are spaced at distances from each other equal to the ceiling height minus 4 feet, multiplied by a factor of choice between 1.25 to 1.34. For example, given a finished ceiling height of 10 feet, speakers should be spaced no farther apart than on 8-foot centers, i.e., 1.34 (10 - 4) = between 7.5 and 8.0 feet; while with a 16-foot-high ceiling, they would be spaced on centers between 15 to 16 feet. Understandably in an auditorium with a stepped or sloped floor, the ceiling-speaker distances from each other should vary with the changing ceiling height. 363.7.63. Assistive Listening Devices. In auditoriums and other educational spaces where the public is likely to gather for special events, provisions for assistive listening devices need to be provided for the hearing challenged. Since there are a variety of different types, with each type having unique features, it is recommended that a detailed study of the particular needs of a facility and its likely occupants be conducted before any specific system is purchased.
36.3.8 The Luminous Environment
36.3.8.1. Lighting Systems 363.8.1.1. General Lighting. A learning environment requires lighting that produces a pattern of brightness from room surfaces which is aesthetically pleasing and which promotes good depth perception. Illumination or, using the currently more correct terminology, illuminance, on major and supplementary task areas, such as chalk or dry-mark boards, tackboards, desks, and other work surfaces, should allow participants to complete visual tasks in comfort and with a high degree of efficiency. Because of their long life and energy efficiency, fluorescent luminaires are preferred over incandescents, except in special situations where directionality and modeling are critical or where room aesthetics are a major factor (Bennett, 1985). 36.3.8.1.2. Supplementary Lighting. The use of supplementary lighting on flip charts, maps, models, etc., capitalizes on the natural attraction that people have toward bright areas within their visual field. Research shows that people are less distracted by a room's surroundings and give more attention to displays with supplementary illumination than those without (LaGuisa & Perney, 1973, 1974). The message here for both the facility designer and the classroom teacher is a fairly simple one: Provide and utilize supplementary lighting on all principal display surfaces. 36.3.8.1.3. Indirect Lighting. Wide-angle dispersion indirect lighting has proved particularly desirable in rooms where VDTs are used, since it minimizes distracting reflections from luminaires seen on the VDf ~'screen (Hedge et al., 1989). But a direct-lighting component is a practical requirement during media projection where notetaking is required and control of light away from the display areas is necessary. Consequently, the ideal lighting system for today's classrooms is one that combines a wide-dispersion indirect-lighting unit for general learning activities and computer work, and a second component with narrowdispersion direct low-level illuminance on notetaking task areas, separately controlled, to be used during audiovisual presentations. 36.3.8.1.4. Lighting Control and Windowless Rooms. Illuminance control is imperative, particularly in rooms where visual-display media are used. Ideally, there should be no windows in rooms used primarily for computer training and for media presentations. They introduce unwanted light, heat, and noise. However, if windows are required, then the room should be equipped with sunscreens, audiovisual blinds, and/or opaque drapes so that sunlight does not "wash out" projected images or create glare on marker boards and VDT screens. The controversy surrounding the absence or presence of windows in educational spaces has yet to be settled. Knirk (1992) covered the topic about as thoroughly as anyone when he stated:
Research does not support those claiming that windowless learning spaces will allow increased concentration and thus higher achievement.... On the other hand, data do not support those educators fearing that the absence of windows will have harmful psychological or physical effects on the students and staff. Windowless learning spaces provide more control over the learner's environment ... the level of visual and auditory distractions are lower ... with computers, windowless environments reduce glare and light levels. Temperature can be regulated and chances of vandalism are lessened in windowless environments. My own experience has indicated that having both windowed and windowless rooms in a learning environment are desirable. The windowed spaces should be allocated to standard classrooms and office spaces, while the windowless areas relegated to those spaces that are to be used to house computers and training/conference rooms having extensive media-display components. And while the preference at the elementary and secondary school level is clearly for windowed rooms, college students seem to accept equally both kinds of spaces, if the wall color treatment and the lighting of the windowless rooms is to their liking. And in high-tech and business training and meeting environments, particularly those having extensive display facilities, there seems to be a preference for windowless rooms, particularly where the room lighting has been appropriately designed. Figure 36-17 shows photographs of one of six windowless rooms I designed for the New England Telephone Leaming Center in Marlboro, Massachusetts. These rooms all featured an indirect-lighting ceiling cove that served to draw the attention of the occupants inward and away from the room's perimeter. They also included scene switched fluorescent lights, incandescent downlights on dimmer, and wall washers. These room's proved to be more popular to the attendees and their session leaders than the 12 other rooms having windows. One of the reasons cited for this preference by the session leaders was the additional tackable walls for displaying their flip-chart materials and product display artwork. The attendees on the other hand seemed to feel that the windowless rooms were less distracting and visually more comfortable over long sessions than the windowed rooms. It should be noted that in this environment and in the training program, there were many opportunities and places for the attendees to have extended views of the outdoors. 36.3.8.2. Illumination (Illuminance) Levels. The preferred term for illumination today is illuminance, measured in either foot-candles (FQ or Lux (I FC = approximately 10.7 Lux). Since most of the research cited herein has used "foot-candles," this term will be used throughout. However, with the unit equivalent just provided, readers may easily make their own conversions to Lux. And where research and luminance standards specifically refer to Lux, such units will be cited. 363.8.2.1. General Tasks. Illuminance levels of 30 to 50 foot-candles (FQ are recommended for general educational activities, with the lower end of that range being appropriate for exclusively VDT work (Zmirak, 1993), and the upper end for reading books and writing (McVey, 1971). According to Zmirak (1993), providing an illuminance level of 30 FC in computer labs where students only work off the screen will result in improved student efficiency and reduced energy costs. Christinaz and Knirk (1987), while accepting a 30 to 75 FC range for general activities, note that when designing for VDT use, illuminance levels should be based on the readability of associated materials and the surrounding area. They warn that strict adherence to raw foot-candle standards will not in themselves ensure sufficient or efficient task illumination. Support for this more qualitative approach can be found in Grandjean (1982a), who states (p. 271) that:
Specifications for lighting levels can be no more than general guidelines, and other circumstances must be taken into account in any particular situation, for example: (a) the reflectivity (color and material) of the working materials and of the surroundings, (b) the extent of difference from natural lighting, (c) whether it is necessary to use artificial lighting during the daytime, and (d) the age of the people concerned.
36.3.8.2.2. Visually Demanding Tasks. Levels of 100 to 150 FC are recommended for critical visual tasks (artwork, etc.). A variable illumination range of 0 to 30 FC is recommended for AV/TV use (die lower levels used for video, LCD panel display, and motion picture projection; the upper levels for slide projection, and even higher levels for standard overhead transparency projection). Classrooms and conference rooms used for participants 50 years old and older need more illumination for notetaking than rooms used exclusively by their younger counterparts (NRC, 1987). 36.3.8.3. Refiectances. Gloss refers to the specular (mirrorlike) nature of some finishes. The combination of excessive gloss and direct illuminance can create distracting glare. Consequently, low levels of gloss, i.e., matte or satin finishes, are recommended for all furnishings that students are to read from. And the ANSI/HFS (1988) standards specifies this limit to be 45% or less when measured with a 60' gloss meter or equivalent device. The term reflectance refers to the percentage of light that a finish is capable of reflecting. Too little reflectance in a finish can create a "gloomy" environment, while reflectances that are too high can contribute to a "glaring" environment. To keep reflections at comfortable levels, the following surface reflectances are recommended (Kaufman, 198 1):
Desktops: matte finish, 30-50% Floors: natural woods or light-colored tile or carpet, 30-50% Chalkboards: green, not to exceed 20%; gray or black, under 10% Walls: matte finish, 40-60% Ceiling: 70-90%
36.3.8.4. Brightness (Luminance) Contrast Ratios. The term brightness refers to a perceptual value and has been incorrectly used for many years; researchers meant photometric or measurable brightness. The preferred term for photometric brightness today is luminance; it is measured in either footlamberts (FL) or candela per square meter (cd/M2), sometimes called a nit. One nit is equal to approximately 0.3 footlamberts. Since most of the research cited herein has used foodamberts, this term will be used throughout. However, with the unit equivalent just provided, readers may make their own conversions to cd/M2. And where research and luminance standards specifically refer to cdlm2, such units will be cited.
Figure 36-17a. Windowless training conference rooms showing special lighting and display features. (Note vertically oper-able marker board in "use" position in front of rear screen.) Figure 36-17b. Same room but set up in U-shaped seating arrangement. (Note extensive use of acoustic/tack panels, chart trays, magnetic strips, flip charts, and perimeter lighting.)
As noted in 36.2, for about 50 years the Illumination Engineering Society of North America has promoted guidelines that state that the LCR of large adjoining areas should fall somewhere between 1: 1 and 3: 1, with the task area brighter than its surroundings. For areas adjacent to the visual task, the acceptable LCR should fall somewhere between 3:1 and 10: 1 (Kaufman, 198 1; Woodson, 1987). It is believed that observance of the recommended luminance ratio limits will lessen or eliminate visual problems, such as transient adaptation and disability glare at the VDT workstation. The rationale used to support this is based on the fact that when the eye fixates on a task, an adaptation level is established. This adaptation level is initiated by a combination of task luminance and field luminance. As the eye redirects its focus from an area having one luminance level to another area having a different luminance, the eye readapts to the new luminance level. If that luminance difference is significant, the adaptation process will require time. And if that luminance difference is excessive, the reaction will be discomfort, attended by a transient pupillary response. To avoid this, luminance levels of large adjoining areas need to be kept within appropriate limits. There is, however, recent evidence to indicate that the recommended luminance contrast range between task and surround, i.e, between a VDT screen and its adjacent source document, given certain conditions may be extended to a ratio as high as 1:20 without affecting visual performance (Haubner & Kokoschka, 1983). This extended range of luminances seems particularly appropriate when the central visual task involves a VDT with a negative polarity screen (light characters on a dark field). It is thought that this is due to the lower average luminance levels created by the dark screen. Support for this can be found in studies by Grandjean (1987), where he noted a marked preference for lower illuminances (and thus luminances) in workstations supporting negative polarity screens than in those supporting positive polarity screens. One reason for this is that negative polarity screens are more adversely affected by excessive ambient illuminance than are positive polarity displays. This extended luminance range may also be appropriate for users of multimedia software or computer-aided-design workstations. Here, users may require lower surround luminances in order to enhance the readability of text and discrimination of the fine detail that is usually present in these types of displays. Figure 36-18, taken from Badolato's (1995) current study, provides an example of the kind of luminances he found at his music workstations. This figure should help readers conceptualize the concept of plotting luminance patterns and lead them toward taking the same approach in evaluating their own learning environments. 36.3.8.5. Glare. When recommended luminance contrast ratios are exceeded by a significant amount, such as when there is an unduly bright source of light in the visual field or when specular (mirrorlike) reflectances fall on a display surface, they create glare. Glare is a luminous condition that brings about discomfort and/or a reduction in visual acuity (Kaufman, 198 1). Most glare in the learning environment equipped with VDTs can be eliminated or reduced by the following methods:
Place the display perpendicular to the light source to reduce reflected glare. Shield the eyes from light sources. Use filters or a coating of the VDT screen; a flat or even slightly concave filter will reduce the area reflected by a curved VDT screen. For lighting, use indirect sources or use several lowintensity lights rather than one light of high intensity.
I As people age beyond 50 years, they become increasingly more sensitive to glare (NRC, 1987). The careful control of all glare sources is especially important for the comfort and visual efficiency of older members of the workforce and training programs. 363.8.5.1. Controlling Luminaire Glare. In order to keep glare from light fixtures (luminaires) at acceptable levels at the VDT screen, the Illuminating Engineering Society of North America produced a standard for VDT workspaces (IES, RP-24). Under this standard, indirect lighting systems are strongly recommended and luminance emission limits for direct lighting luminaires given maximum limits relative to specific viewing angles. The maximum allowable luminance at a viewing angle 85' from the vertical is 175 cd/m2; at 750, 350 cd/m2; and at 650, 850 cd/m2. This standard is currently being complied with or even exceeded by today's luminaire manufacturers. While compliance with this standard will reduce excessive glare at the VDT screen, it will also result in perimeter walls being excessively dark, unless illuminated by supplemental wall washer lighting or unless the spacing currently used between lutninaires is reduced significantly. Consequently, there are those who find this IES standard problematic (Rea, 1991). 363.8.5.2. DisplaylSurround Luminance Ratios. There is a perceptual conflict when a display is surrounded by areas of greater brightness than its own, such as when a TV monitor or computer screen is set up next to an unshaded window. If this difference is modest, then at best this conflict will result in only a distraction from the visual task. If this difference is great, then viewers are faced with the dilemma of attempting to attend to the visual task while their autonomic defensive mechanism is unconsciously directing them to look away from the area in order to maintain visual comfort. Classroom Intervention: Set up visual displays where there are no excessively bright areas to surround it. If the display is not the self-illuminated kind, i.e., TV, computer screen, then provide supplementary illumination on the display. 36.3.8.5.3. Luminance Contrasts within the Visual Display. The above luminance contrast limits between adjoining visual areas relates to relatively large areas, i.e., the overall VDT screen brightness relative to the area surrounding it. However, these contrast limits should not be confused with those recommended for visual elements within the task itself-for example, print in a book, chalk or marker on a board, alphanumerics on a slide or vugraph foil, a motion picture scene, etc., all of which need to be greater than those recommended for large adjoining areas. Lack of sufficient contrast between the design elements within the visual itself will seriously affect its legibility and readability. Contrast ratios of 10: 1 between the dark and light elements of video or vugraph display are generally accepted, while ratios of 25:1 for slides with dark elements on a light background and 5:1 for light elements on a dark background are recommended. Recommended contrast ratios between dark and light elements in a motion picture film can be as high as 100: 1 (Caravaty & Winslow, 1964). Classroom Intervention: Chalkboards and marker boards should be kept clean of old chalk and marker dust so that there is sufficient contrast between what is written on the board and the board itself. All projected visual media should be shown in rooms dark enough so that image details and colors are accurately rendered, but no darker. 36.3.8.6. Other Properties of Light. In addition to providing radiant energy with which to see objects, there are spectral aspects of lighting that can effect how accurately colors can be seen, the appearance of the lamps themselves, and contribute to a number of psychological and physiological conditions affecting people.
363.8.6 1. Light Quality and Control for Media Use. Since all types of artificial illumination reproduce colors differently, the selection of lamps should be based not only on the amount of light they produce but also on their color appearance (how they will look in the room) and colorrendering qualities (how objects will appear under their illumination). Also, since there is a need to control illuminance levels during media presentations, this factor should enter into the decision in lamp selection as well. To accommodate such special needs, it is recommended that one use incandescent downfights on dimmers (or low-wattage compact fluorescent in parabolic fixtures) for low light levels in front-screen presentation rooms, and quartz lights or asymmetric fluorescent fixtures with lamp color temperatures between 3,000' and 3,500' Kelvin and color indices of 80 or higher for rooms where video conferencing and video recording are planned. Classroom Intervention: The teacher needs to realize that objects will take on a different color appearance when illuminated by different lamps. Efforts should be made to acquire lamps with high color rendition accuracy for art rooms and to display artworks under the same kind of illumination under which they were created. Replacing the three or four lamps in a fixture above a critical display is a relatively simple and inexpensive matter, and the lamps have a life expectancy of about 20,000 hours. When trying to match colors, and where high color rendition fluorescent lighting is not available, do your matching under daylight, which has a color rendition of 100.
Figure 36-18. Illuminance levels and resultant luminance patterns in a music education workstation. (After Badolato, 1995.)
36.3.8.6.2. Light Quality, Moods, and Physiological Benefits. Research by Hathaway (1988) has shown that the color of light and its quality are important to the learning atmosphere, and he recommends UV-enhanced full-spectrum lighting, particularly for geographic areas where seasonal affective disorders (SAD) are noted. According to Hathaway (1994), under such lighting, elementary students developed fewer dental cavities (an accepted stress index) and had better attendance, achievement, and growth and development than students under other lights. This study went on to report that students under high-pressure sodium vapor lamps had the slowest rates of growth and development, as well as the poorest attendance and achievement. While the full-spectrum UV-enhanced lamps appeared to offer some physical benefits over cool-white fluorescent, there were no differences found in achievement. It is unfortunate that this study did not include the 32w T8 triphosphor lamps that currently are being selected for many schools and offices because of their high color rendition, pleasant color appearance, and energy benefits. It would be useful to know how such lamps stack up to the ftillspectrum UV-enhanced lamps promoted in Hathaway's study. A review of the literature finds the research to be equivocal on the benefits of full-spectrum lighting (Boray et al., 1989). 363.8.63. Light Quantity and Physiological Benefits. Similarly, there are strong advocates for using inordinately high light levels (300 FC+) to "optimize human health, performance, and well-being, and recommend such levels for treating depression, sleep disorders, and dysfunctions of the circadian system related to jet travel and shift work" (Brainard, 1994). However, more research will be required before facility planners will be able to justify the added energy costs required to produce such levels, and to mount effective arguments for exceeding state energy codes. In the meantime, the popularity of tri-phosphor T8 lamps for general classroom/training rooms has grown over the past decade and seems to be here to stay for some time, given their high color rendition and color appearance qualities and their reduced energy consumption.
36.3.9 Color
36.3.9.1. The Power of Color. Color is a vital part of our lives. It can change moods and judgments of size, weight, and distance, induce body tonus, and in general enhance the quality of life. Many of our psychophysical responses to light have been attributed to the phenomenon known as chromatic aberration, where the lens of the eye has to physically change its shape in order to bring different colors into focus. Depending on the direction of this adjustment, a color will appear to be perceived as "approaching" or "receding." At least one researcher (Hannon, 1951) believes that chromatic aberration is the likely physiological basis for the psychological effects of colors, i.e., for our perception of colors as "warie' and "stimulating" or "cool" and "relaxing."
When used properly and combined with the right kind of illumination, color can be an effective tool for the facility designer and the classroom teacher. In spite of some ambiguity in the literature as to the uniformity of human responses to different colors (Cohen & Trostle, 1990; Mikellides, 1990), it is generally accepted that color has relatively predictable behavioral concomitants both as a surface treatment and as a light source. Different colors evoke different physiological awareness levels and emotional/attitudinal responses (Gerard, 1958; Ali, 1972; Birren, 1969) as well as producing different psychospatial effects. 36.3.9.2. Responses to Color. Burch (1993) recently referred to cognitive and emotional responses as being byproducts of the lighting and color used in the learning environment when he stated:
Architects have known ... that light and color created moods within spaces. Now we know that the neo-cortex of the brain, the conscious rational side, responds to subtle, sophisticated colors, while the limbic, or emotional set of the brain, responds to vivid hues.
Other researchers have noted the effect of colors on blood pressure, respiration, task confusion, and reaction time (Kwallek & Lewis, 1990; Sanders & McCormick, 1987). Knirk (1987) believes that room colors are powerful instructional tools that can be used to "assist the student into a mental state conducive to the behaviors required by the objectives." In making his case, he goes on to report the work of Zental (1986), who found that test scores increased by 12 points on an IQ test in a room that was light blue; whereas in a white or brown room, the scores decreased by 14 points. Knirk concludes from this and other studies that "... in classrooms and labs, where there is close visual and mental work, tints of blue-green, gray, or beige are desirable colors." My own research supports these statements leading to the following generalizations:
- Room colors, particularly areas within the visual field, should be relatively neutral and in desaturated tones, such as off-white with umbra added, light gray, sandalwood, light buckskin, etc. If bold colors are desired in the classroom, they should be confined to surfaces outside the line of sight of the students, such as the back and side walls, and the floor. - Fully saturated bold colors, particularly blues and reds, are stressful, and should be avoided on walls, especially on surfaces that may be used as backgrounds for visual displays. Such colors should be confined to artwork, wall murals, display exhibits, and the like, where exaggerated feelings of depth or visual excitement are specifically desired. - Light chalk green, gray with a touch of umbra, off-white, and beige are visually neutral and should be used for end walls that are planned as backgrounds for visual displays or projection screen locations (McVey, 1988). Classroom Intervention: Many elementary school teachers make use of the effects of chromatic aberration by wearing bright and colorful clothes on days when they plan to introduce new and difficult lessons. Their experience has been that the students seem to sense that something new and interesting is going to happen. Visual displays such as slides, bulletin boards, and dioramas can also make good use of the psychospatial. effects of colors by highlighting the most important elements with red and orange and adding depth to the backgrounds with shades of blue.
36. 10 Thermal and Air Quality Factors
Thermal comfort is a product of many interactions. Auliciems (1989) cites the interaction of such personal and atmospheric factors as a person's metabolic rate, which relates to the physical demands of the task, clothing insulation, air temperature, radiant temperature of surroundings, rate of air movement, and atmospheric humidity as the contributory factors. To this, Heijs and Stringer (1988) add the personal factors of one's knowledge and experience, gender, age, and place of residence, as well as such architectural elements as lighting and furnishings. Figure 36-19, adapted from Woodson (1992), illustrates the effects of season, clothing, relative humidity, or temperature requirements. It is because of such interactions that ASHRAE developed its concept of the "effective temperature" scale as a better predictor of comfort than the standard temperature scale. 36.3.10.1. General Effects of Heat and Humidity. The nature of the exchange of heat and humidity between people and their surroundings is a major factor affecting mental alertness, level of comfort, and the effectiveness with which they complete their tasks. The amount of environmental heat necessary for comfort will vary with a person's age, level of physical activity, clothing, and adaptation to local climate. Girls, -in general, seem to prefer a warmer environment than boys, and young children prefer a cooler one than all but the oldest adults. One study indicates that a student's achievement level may affect his or her sensitivity to heat (Lane, 1966).
Figure 36-19. Effect of season, clothing, and relative humidity on temperature requirements.
Another study has found that certain temperatures evoke high levels of arousal, while others evoke dull attention (Wyon, 1970). An improper thermal environment can alter growth, development, and learning (Hannon, 1953). Children tend to become restless in a cold room and listless in a hot one. According to one researcher, there is reason to believe that students may experience a 2% reduction in learning ability for every degree that the room temperature rises above the optimum (Gilliland, 1969). Room temperatures between 68T and 76'F generally promote normal functioning, given standard recommended levels of relative humidity and air velocity 36.3.10.2. Effects of Heat on Performance. There is support in the literature for one to accept that thermal and air quality factors are perhaps the most important environmental elements in the work environment (Rohles, 1989). High temperatures can influence performance of various tasks. With young adults, Eckenrode and Abbot (1959) found 80T to be the maximum temperature for the normal performance of the following tasks, with 87'F being the temperature where demonstrable impairment was noted:
Typewriter code (scrambled letters), locations (spatial relations code), mental multiplications (problems), number checking (error detection), pursuit (visual maze), and ladle operations (hand coordination).
Additional tasks and their normal performance/demonstrable impairment (N/I) temperatures follow:
Morse code reception 87.5/92, block coding (problem solving) 83/87.5, visual attention (erratic clock test) 79/87.5, Pursuitmeter 87.5/92, reaction time (simple response) 93/.... motor coordination 64.5/9 1.
There are not many studies available concerning the optimum classroom temperature for the very young student. One such study from Canada by Partridge and MacLean (1935) indicates that the optimum temperature in summer for young children is 70.5'F, with a relative humidity of 50% or a dry bulb temperature of 75.5'. In winter, this optimum temperature was said to change to 66.5'F, with a relative humidity of 35% or a dry bulb reading of 71'. This, however, cannot be accepted as a rigid recommendation, for thermal needs are quite individualistic, and, furthermore, these readings are not totally consistent with the most recent ASHRAE recommendations, which will be discussed later. Classroom Intervention: There are those who cite the higher rate of metabolism that children have as being the reason why they seem to operate more effectively at lower temperatures than adults, and this has led to the suggestion that an effective rule of thumb for a teacher to follow is to wear a sweater or jacket in class and set the temperature for his or her comfort. The children, because of their higher rate of metabolism, should now be comfortable in their shirt sleeves. Tessmer (1994) suggests that moving the seat locations of students further apart from each other can increase airflow between seats, thus reducing the sense of a classroom feeling too hot as well as too crowded. This is particularly true when students have returned from a gym session or recess. 36.3.10.3. Solar Heat Gain. Radiation from the sun may also aid or play havoc with student comfort. Solar energy radiated in the form of visible light passes through classroom windows and is absorbed by objects lying directly in its path, which then convert the light into heat, This heat, in turn, is radiated to the rest of the room. The average classroom is like a greenhouse, a one-way trap for infrared radiation. While the glass windows allow sunlight in, they do not allow much of the resultant radiant heat to escape. This heat can affect the overall room temperature and cause wide temperature swings during a day. Most affected are students seated next to the windows, who may actually be receiving excessive heat exposure even though the average room temperature is not above normal. This "greenhouse effect" can be minimized by (a) better site planning with regard to the sun's transit, (b) large roof overhang, (c) tinted windows, (d) fewer or no windows, and (e) reflected shades or blinds. Classroom Intervention: The classroom teacher should monitor the seats closest to the windows for excessive solar heat gain, adjust the shades accordingly, and provide additional ventilation when needed by opening windows at student work height. The students should also feet free to make adjustments on their own, as long as doing so does not negatively affect others nearby, or simply move to another seat if bothered by excessive solar heat exposure. 36.3.10.4. Air Movement Some researchers feel that providing enough heat for the students is not the problem; the problem is providing proper ventilation, air circulation, and cooling. In one study, it was found that any time the outdoor temperature reached 50'F, the classroom temperature rose above the desirable level, unless cooling was introduced (Lane, 1966). No wonder, since physiologists tell us that each child of elementary school age radiates heat equivalent to that radiated by a 100-watt incandescent lamp. It is not unusual for a classroom to show a 4' to 5' rise in temperature shortly after the students return from an active recess. In educational facilities, air conditioning should not be considered a luxury, but rather an integral and critical environmental component. Air movement's role in the thermal environment is to promote convection and evaporation, two natural methods of heat dispersion that help the body rid itself of excessive heat buildup during the performance of work and study tasks. If this work-related body heat is not lost, performance and physical comfort will be affected. In fact, some specialists have gone so far as to claim that most of the headaches, fatigue, dizziness, and nausea experienced in crowded, poorly ventilated rooms are caused not by high temperature, high humidity, or even high concentration of carbon dioxide, but rather by inadequate body heat loss due to lack of air movement (Lane, 1966). Although air movement is vital for the elimination of superfluous body heat, excessive air movement results in too much body heat loss and makes it necessary to increase the overall room temperature in order to maintain comfort. Needless to say, drafty rooms should be avoided as places of study. 36.3.10.5. Effect of Humidity on Performance. Knirk (1992) notes that when a room's relative humidity (RH) rises above 70%, it impairs human performance. He goes on to cite the work of other researchers who found that low relative humidities also reduced the quality of the learning experience and that "students attending schools with relative humidities between 22% and 26% experienced nearly 13% greater illness and absenteeism than students in schools with 27% and 33% RH. Excessive humidity in the thermal environment can also affect the reliability of equipment. Excessive humidity has been known to cause serious damage to computer equipment General recommendations adapted from the 1992 ASHRAE handbook, which will serve both people and sensitive electronic equipment, follow:
1. Air temperature should be kept constant within a range of 68 to 74'F during the winter and 73 to 79'F during the summer (with lighter clothing). 2. Relative humidity should be kept within a range of 30 to 60% in most classrooms and 50% constant in computer training rooms. 3. Air velocity should be kept with 15 to 25 feet per minute for low-activity rooms. and 25 to 50 fpm for rooms programmed for greater physical activity. 4. Outside air in quantities of 10 to 25 cubic feet per minute should be provided for each occupant. 5. The room's ambient temperature should be uniform (+/- 2'F) at working height throughout the room, within I foot from exterior walls. 6. The room should be serviced by automatic control systems, integrated thermostats, and automatic timing devices for day-night operations. 7. Fully operational heating, ventilation, and air-conditioning systems should be available whenever possible, particularly for those schools and training and conference centers that operate year round. 8. Rooms that employ extensive audiovisual equipment and computer-related equipment should have additional cooling in direct proportion to the heat produced by these media.
363.10.5.1. Thermal Limits for Media and Technology. While adhering to the thermal conditions cited in 36.3.10.5 will accommodate both people and audiovisual equipmen~ in 1970 the Educational Facilities Laboratories issued guidelines in terms of thermal limits for various media. Perhaps the reader will find their inclusion here of some practical value (EFL, 1970):
1. Computer facilities: Constant temperature of 75'F with 50% RH. Operational limits: Dry-bulb temperature of 60-90'F, relative humidity of 20-80%, maximum dry-bulb temperature of 78'F. Recommend 1/4-ton cooling per computer-assisted instruction (CAI) sta-
tion. (Author ~ note: This last recommendation was based on what constituted a CAI station in 1970; a more accurate assessment can be made today by adding up the total wattage of each component in a VDT workstation, i.e., monitor, CPU, printers, server, etc., and multiply this number by 3.42 to determine the number of BTUs per hour that can be expected from this equipment during operations.) 2. Film projectors (slide, motion picture, etc.): 65-70'F and 25-40% RH. 3. Film storage: Below 80'F and 25-60% RH. 4. Audiotape storage: 60-90'F and 20-80% RH.
36.3.10.6. Air Distribution. The standard air distribution system for most rooms is centralized, with air being supplied from specific locations in the ceiling. This works well for standard workspaces and classrooms but is problematic in open-plan offices and learning resource centers because of the presence of work and study stations with self-standing partitions. Because of these partitions, the room's central air supply is often short circuited across the ceiling, and "still aie, pockets are created. In response to such problems, newly designed heat distribution and ventilation systems that operate in a decentralized manner are now available. One version is a "task-under-flooe, ventilation system (TUFV). A study employing this system and involving six facility managers and 151 office workers found that the facility managers recorded fewer complaints about thermal discomfort and ventilation problems than in their previous buildings where a standard system had been employed. And the majority of the 151 office workers said that TLJFV improved thermal comfort and perceived air quality, as well as providing good temperature and ventilation conditions, better supporting work productivity, and worker alertness (Hedge et al., 1990). 36.3.10.7. Air Quality 36.3.10.7.1. 77ie Sick Building Syndrome. In considering air quality, it is noted that a growing number of schools and daycare centers and libraries are included in the category of 44 sick buildings" (Norbock et al., 1990; Yeung et al., 1991). Causes for this are symptoms such as itching skin, eye irritation, headache, nausea, respiratory problems, fatigue, and complaints of odor and disagreeable taste. These complaints center on the concentration of volatile organic hydrocarbons and the presence of wall-to-wall carpet (Noback & Widstrom, 1989). There is growing consensus that these symptoms are related to physical factors such as air temperature, pollutants, and biological factors like pollen and mold, as well as psychological factors (Potter, 1988). Excessive levels of static electricity are also cited as contributory causes of eye and skin irritations (Wedberg, 1987). The causes of the recent increase in the level of pollutants found in our newly constructed offices and learning environments are attributed to new construction techniques and materials. According to Chant (1986) "new office buildings [and presumably schools] aimed at creating a uniform and perfect environment have been designed largely on the basis of building shape and engineering economics, with cheaper materials and construction shortcuts that have in many cases resulted in dangerous working environments." Commenting on this situation, Parsons (1992) stated that: "new building materials often give off fumes, particularly fumes containing formaldehyde. New office partitions and furniture, especially those made from particle board and other manufactured wood products, contain high concentrations of formaldehyde." Parsons goes on to indicate that formaldehyde can also be released from rugs, drapes, and other textiles. He also adds paints, solvents, wood preservatives, asbestos, glass fibers, cleaning agents, correction fluid, and pesticides to his list of building pollutants. 36.3.10.7.2. Air Quality and Emissions. Classroom and conference room air quality should meet and, where possible, exceed the requirements for office environments as specified in ANSI/ASHRAE 62-1992 standard. This standard stipulates that the maximum emission rate for total volatile organic compounds released in a room should not exceed 0.25 mg/hr/M3, and carbon dioxide should be kept below 800 ppm. Other emissions of concern include the electromagnetic emissions that are created by VDTs, building wiring, lowvoltage lamps, and other electrical devices (Pool, 1990). Such emissions fall into the primary divisions: ELF, 5 Hz-2 kHz, VLF, 2 kHz-400 kHz, RF, and microwave. At the present time a causal relationship between EMFs and physical discomfort and illness has not been clearly established. On the other hand, there is considerable scientific evidence that raises concern and promotes continued research on the subject (Burgess, 1992). And, compounding this problem is the cumulative effect likely to be found in the computer laboratory where 20 or more monitors operate simultaneously (Ross & Stewart, 1993; Frost, 1992). Facility planners, architects, and school administrators need to monitor this potential problem and give consideration to relevant research findings.
36.3.11 Display Systems
36.3.11.1. Basic Requirements. One of the most important components of the learning environment, and particularly of spaces used for media presentations, is the display system. Display systems range in sophistication from a basic setup that typically includes a television monitor, a slide projector, and a matte white screen, to highly complex front- and rear-projection multimedia systems. They can be as simple to operate and maintain as an overhead transparency projector or as complex as light-valve television projectors or plasma displays hooked up to an interactive computer program. In all cases they require the same basic considerations if they are to serve the function for which they were designed. It has been long established
that display systems in order to be effective should have the following characteristics (Meister et al., 1969):
1. High legibility of individual characters and meaningful groups of symbols and words easily recognizable 2. Easy detectability of weak signals at all display ranges and at long and short viewing distances 3. Comfortable and accurate viewing at any required viewing angle 4. Minimum fall-off in image brightness at all viewing* angles 5. Appropriate brightness-contrast, good resolution, and minimal image distortion 6. Qualities that elicit high observer accuracy and response time in performing visual functions 7. No apparent flicker for any of the viewers 8. Effective viewing within entire operating range of ambient illumination 9. Response with minimal equipment delay to user's request for display, as in information retrieval systems 10. Display parameters (brightness and contrast) adjustable by user 11. Audio signals of sufficient strength and fidelity to provide accurate and comfortable hearing for all listeners 12. Sound and image that appear to emanate from same location 13. Properly coded display controls for ease and accuracy of operation 14. Equipment and components that can be maintained by in-house technical staff 15. Adaptability for the inclusion of new presentation devices
36.3.11.2. Front- and Rear-Screen Projection. The two display systems commonly employed in classrooms, auditoria, and technical presentation facilities are frontand rear-screen projection. Each system has its merits and limitations. Consequently, it is not unusual and frequently advisable for a facility to be provided with both systems. 363.11.2. 1. Front-Screen Projection. In a front-projection system, an image is produced by reflection off an opaque screen. Screen types include matte, ultramatte, beaded, lenticular, and aluminum foil. The -standard matte screen is recommended for general applications and wideangle viewing; the ultramatte should be used for higher image luminance, while still providing wide-angle viewing. Beaded screens are often recommended for rooms with narrow viewing sectors and where higher image luminance is required from standard projection equipment. Fixed, perforated lenticular screens are standard equipment for motion picture theaters, and the aluminum foil screen is used for special situations involving high ambient illumination and low-luminance television projection. 36.3.11.2.2. Rear-Screen Projection. In a rear-projection system, an image is produced by transmission through a translucent vinyl, acrylic, or glass screen. Rear-projection screens have found high acceptance in conference and training centers, where media presentations generally occur in rooms with high ambient illumination (McVey & Powell, 1985). These screens are widely available in a variety of colors and "gain" features. 363.11.2.3. Screen Gain. The "gain" of a screen refers to its light distribution characteristics. The most popular are the low-gain (1.2 to 1.8) screens for wide viewing sectors, and the moderately high-gain screens (2.0 to 3.0) for the more narrow viewing sectors or where greater image luminance is required under higher ambient illumination levels. Standard microdiffusion rear-projection screens with higher gains are usually unsatisfactory for general applications since they project noticeable hot spots. But recently a number of manufacturers have developed acrylic screens that employ fresnel lens technology and lenticulation to produce wide-angle viewing and higher gain (principally in the horizontal sector). These screens appear ideally suited for video display but are limited in size (about 12.5 feet diagonal) and cost significantly more than conventional RP screens. While it has been generally accepted that front projection provides better image quality than rear projection, at least one study found that in terms of rendering print legible, both forms of projection (matte white vs. RP with 2.0 gain) yielded equivalent scores from graduate students, even when using alphanumerics measuring only 10, 8, and 6 subtended arc-minutes (Hamilton, 1983). 36.3.11.2.4. Rear or Front. A survey of the 10 leading conference centers in the United States relative to their existing and desired facilities found that the greatest number of requests by the managers was for fixed rear-projection facilities (McVey & Powell, 1985). Similar responses are now coming from business and higher-education organizations. Information relative to projection systems is continually updated and readily found in the literature (Utz, 1992). Figure 36-20 shows a marketing/presentation room I recently designed for a computer company, in collaboration with Carl Franceschi of DRA Architects, showing both front- and rear-screen capabilities. This recognizes the fact that each medium has its own special attributes, and that having both provides the users with the capability of modifying their presentation approaches in the future when new technologies may make one of these two display approaches more desirable than the other. 363.11.2.5. Coordinating Lighting with Projection. As noted above, rear projection can be more effective in displaying media in conditions where there is more illumination than most front-projection systems can accommodate. Actually, both rear- and front-screen display can be made more effective by controlling the amount of illumination that falls off the display surface from room lighting during projection. The limits of this nonimage illuminance will vary with the light output of the display system and the reflectivity of the screen surface. For decades, the standard in the motion picture industry for nonimage illuniinance in theaters has been 0.3 foot-candles (Kloepfel, 1969). My own experiments with conventional media indicate the following relative to currently typical media use in today's educational/training environments. These recommendations for permissible light levels may be modified upward where new developments increase the light output of tomorrow's standard projection equipment: Permissible ambient light levels on front projection screens are 0.3 FC with movie and video projection, 1.0 FC with slides and LCD display, and 2.5 FC with overhead projection of high-contrast transparencies. These ambient light levels may be increased significantly with rear-projection display, in direct proportion to the reflectivity of the screen surface. For rear screens having 10% reflectivity, the above levels may be tripled, but for rear screens having a 30% reflectivity, such levels can only be doubled. 36.3.12 ControlIn the learning environment, instructors, presenters, and students are faced on a daily basis with the need to operate various kinds of controls. Some of the controls that the instructor or presenter have to deal with are environmental, and include lighting, window drapery, or shades, and, in some cases, room thermostats. Other controls they operate involve the room's presentation systems, such as projectors, audio- and videotape recorders and players, sound system levels and balance, etc. And others include those that involve the room's security and electrical power systems. The students also are expected to operate many controls. Most of these involve the operation of equipment in their computer workstation, i.e., mouse, joy stick, optical scanner, etc., or portable audiovisual equipment employed in their project activities. For many years now, one of the byproducts of human factors engineering efforts in the military and space programs was the development of practical and effective guidelines for the control of equipment and building systems by the operator. For example, even at the most general level, ergonomists such as Woodson (1981) offered such guidelines relative to control selection, design, and use (p. 570).
Today's equipment designers seem, however, to be ignoring the above and other guidelines that have proved so effective in controlling the complex systems found in military and space programs for past 4 decades. Instead they seem to be driven by a misplaced concept of uniformity and symmetry. Andre and Segal (1994) recently studied what happens when designers attempt to design control panels with total symmetry: "Typically these types of layouts do not allow the user to easily differentiate between controls that serve different functions." They go on to cite that they found amplifiers with as many as 28 similar buttons laid out in a symmetrical pattern. They note: "... such similarity in form between controls further hinders differentiation and requires the user to adapt to the product." According to these authors, the operators are expected to rely on memory and verbal labels to differentiate among variables that are in essence quite different. And this is where the conflict lies: "Switches on computer monitors, buttons on phones, calculators, etc., all are deliberately made less visible (or are omitted) so as not to detract from the so-called aesthetic quality of the product." The direct consequence of designing for reduced visibility is reduced feedback. The psychologist Donald A. Norman (1988, p. 3) addressed this problem of reduced feedback through efforts toward design aesthetics via simplicity when he described how he had tried to operate a particular slide projector: "With only one button to control the slide advance, how could one switch from forward to reverseT' When he asked a technician how he could initiate both functions from one button, he was told that a brief push of the button would send the slide forward; a long push and it would reverse itself. However, even after having an explanation of the system's "logic" without the necessary feedback, he was still unable to operate the projector successfully. This motivated Norman to note that there are psychological principles that should be followed in order to make controls understandable: visibility, appropriate clues, and feedback of one's actions, constituting a psychology of how people interact with things and thus how they should be designed. In designing or selecting a control system for purchase, one needs to be reminded of the "locus of control" theory, which states that a control, system as well as other humantechnology interfaces, should permit the user to feel in control of the system, and not vice versa (Robson & Crelin, 1989). If an ergonornist, is to successfully prescribe the learning environment, he or she must direct attention toward the design of all elements in the leaming environment, and that includes the systems that control audiovisual presentation systems as well as room features. Figures 36-21a, b, and c show examples of the product for which I was asked to design control systems for room lighting and audiovisual equipment The methods employed on the lectern controls systems (Fig. 36-21a) included clustering related controls, color coding, shape coding, and employing knobs for quantitative elements, such as sound levels from both the voice reinforcement and program playback systems, and illuminated feedback switches. The lighting controls (Fig. 36-21b) are set up so that an instructor or presenter simply picks a "scene," i.e., general, vugraph, slides, or video, and in each case the correct light fixtures are left on, with the appropriate number of lamps, for the media to be effectively used and to maximize the available light for the students.
The touch " control panel (Fig. 36-21c) represents a hybrid of modem LCD selection screens, along with discrete buttons to the side of the touch panel which duplicate some of the most frequently used functions. The reason for this is that many people do not need or want to go sequentially through selecting a menu to control such things as volume level, lights, draper, or a projection screen's descent. Readers should be aware that ample information is available to guide their efforts at developing efficacious control systems. These sources include but are not limited to: Woodson and Conover (1973), Van Cott and Kinkade (1972), and Sanders and McCormick (1987). |
|||||||||||||||||||||||||||||||||||||||||||||||||||||||||||||||||||||||||||||||||||||||||||||||||||||||||||||||||||||||||||||||||||||||||||||||||
|
|
|
|
AECT 877.677.AECT
(toll-free) |
|